
Mothernode CRM lets users and administrators alike build their own dashboards. You can share them amongst your team by making them public or make them private to keep them to yourself. You can toggle these options anytime.
The Basics
What’s a Dashboard, What’s a KPI?
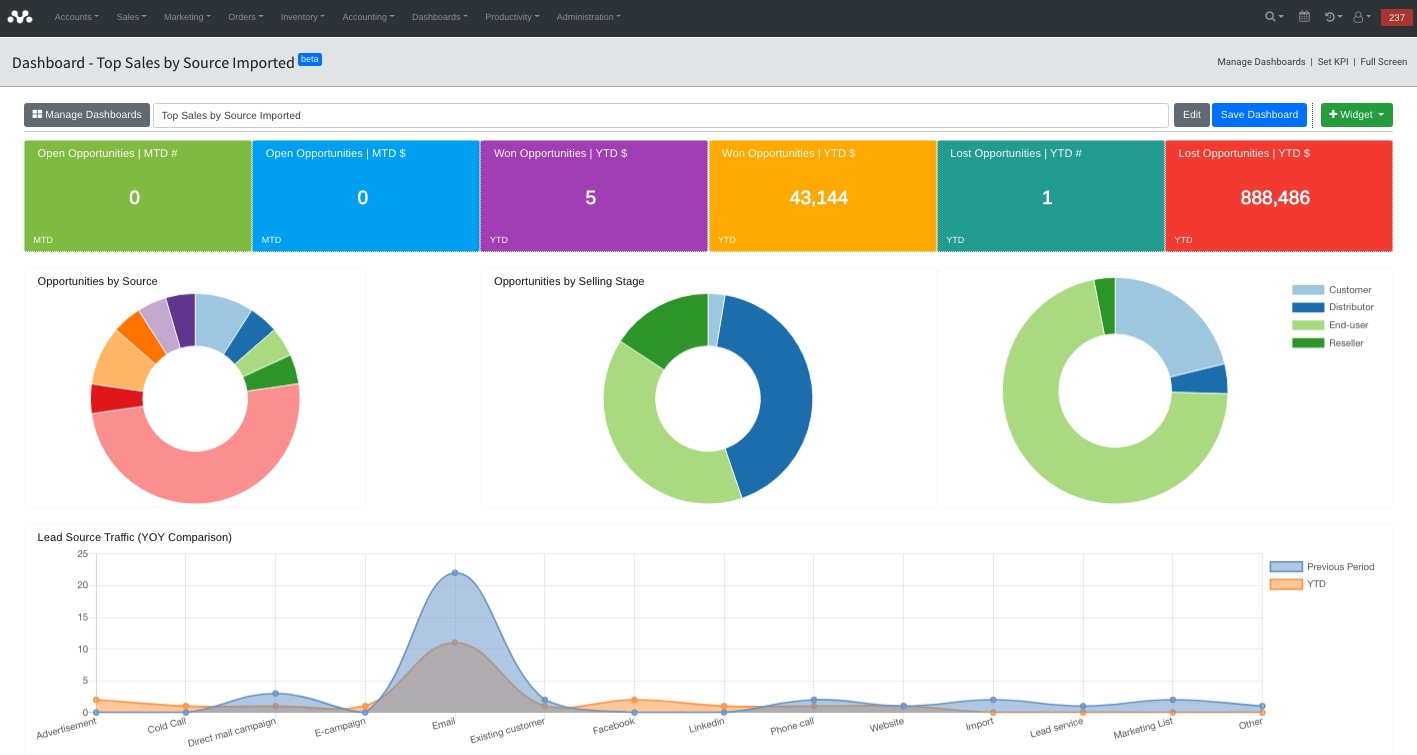
Dashboards are created first. They are the canvas that is used to add the KPIs. KPIs are available in widgets that users can add, drag a place, resize and recolor. Mothernode CRM lets you create unlimited dashboards so you can create as many as you need for different modules.
This is a Dashboard
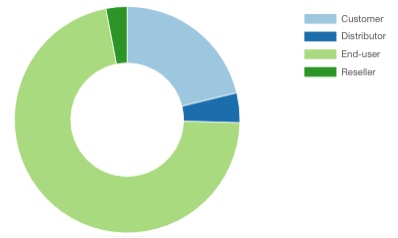
This is a KPI (widget)
Creating and Adding Dashboards
Mothernode lets you create your own customized dashboards (Create) or you can add a predesigned dashboard (Add). Note: If you add a dashboard from the existing library of dashboards, you can further customize it after it has been added.
How to create a new dashboard
- Login to your Mothernode account
- From the dashboard menu, and choose manage dashboards
- Click NEW DASHBOARD
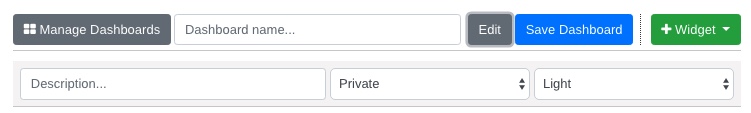
- Name your dashboard and click EDIT to provide a description, make it private or public and choose the color scheme (light or dark)
How to add a dashboard
- Login to your Mothernode account
- From the dashboard menu, and choose manage dashboards
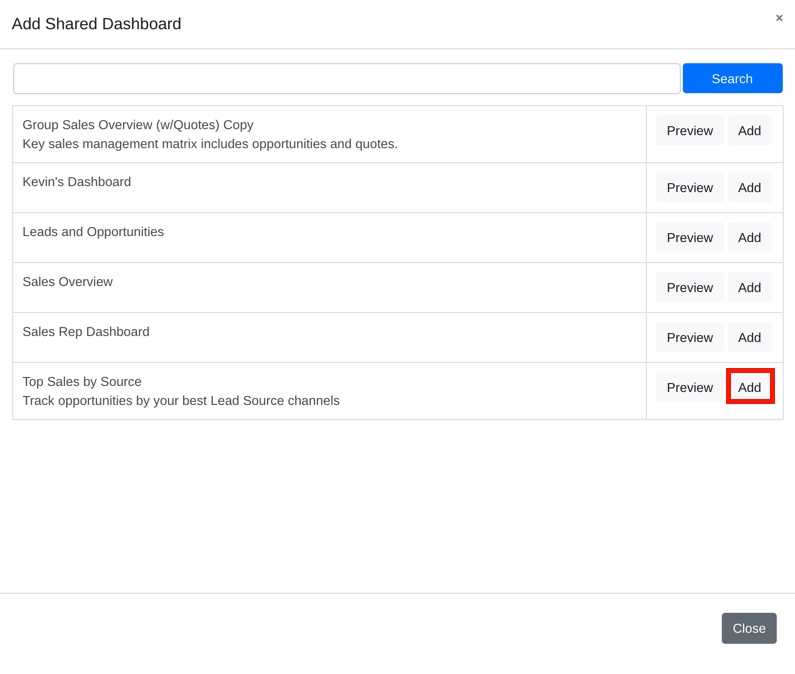
- Click ADD DASHBOARD
- Select the dashboard from the list to add or click preview to see what the dashboard looks like before adding it.
Mothernode KPIs
Once you have a dashboard to work with you can add one or more KPI widgets. There are 3 types of KPIs you can create in your Mothernode CRM Dashboard. There is no limit to the number of KPIs you can add to a dashboard.
- Metric
- Chart
- Table
Metrics
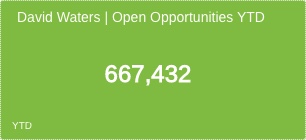
A Metric is a summary number, such as, but not limited to YTD Invoices, MTD Quotes WON, etc.
Chart
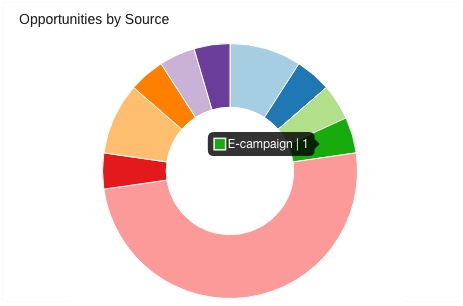 A Chart is a graphical representation of the data you want to display. Mothernode lets users build these types of charts: Pie, Donut, Line, Bar Horizontal, Bar Verticle, Radar and Polar Area.
Table
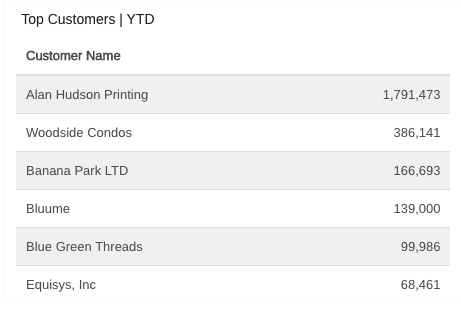
A table is a summary listing of data from highest to lowest. Ideal for Top 10, 25, 50 lists. You can resize tables to reveal or hide rows.
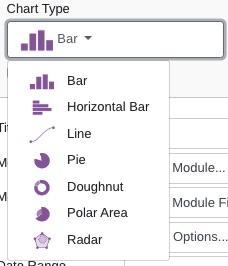
Important: After you add a chart widget, you can define the chart type, however changing the chart type may reset some parameters in the chart, because not all charts have the same capability.
How to add a KPI to your dashboard
- Access the dashboard you want to work in or create a new one
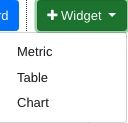
- Click the green + WIDGET button
- Select the type of KPI you want to add from the menu
 Important: Your new KPI will appear at the bottom of the Dashboard. Therefore, if you already have many KPIs on your dashboard you will have to scroll to the bottom of the dashboard to see it.
Duplicating, Resizing and Removing KPI Widgets
Mothernode makes customizing your dashboards quick and easy. You can duplicate your favorite KPIs to make adjustments, remove KPIs you don’t need or resize them to fit your liking, drag them to re-organize them on the dashboard. All of these things can be done once a widget has been added to the dashboard.
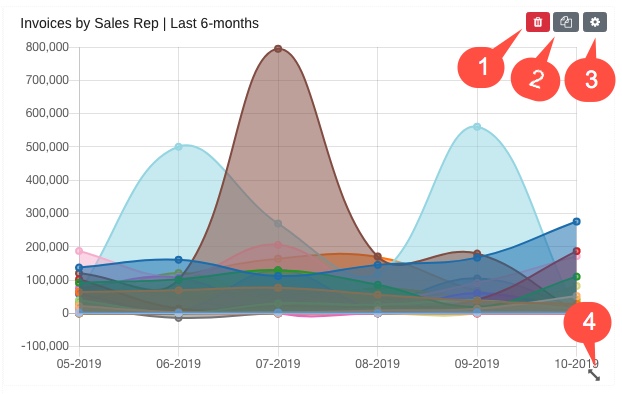
- Remove a KPI from your dashboard
- Duplicate an existing KPI widget
- Edit the KPI settings
- Resize the KPI widget
